

TL;DR
Capex by the four largest hyperscalers is on track to exceed $700B in 2026. The demand signal is strong, but each layer responds on a different clock, and capacity further down the stack moves more slowly and less reversibly.
Power and grid now govern the turn-on timing of new AI capacity. At the same time HBM and advanced packaging still gate the shipment of accelerators that have already been ordered. Bottlenecks move, but the earlier constraint does not disappear.
Shortage on its own is not an investment thesis. Scarcity becomes pricing power only after passing through qualified supplier set, switching time, substitution path and contract structure. Only then is it worth asking whether that price amplifies into earnings through volume, content and operating leverage. The location of the bottleneck does not decide economic capture. The supplier set and contract structure around it do.
My two calls are explicit. Power and grid are likely to remain the dominant constraint on new capacity at least through 2027, and data movement is likely to take a larger share of AI system economics through 2028. But bandwidth growth and optical revenue growth are not the same thesis.
Disclaimer This note is for information only and is not a recommendation to buy or sell any security. Company results are taken from official filings and releases; industry figures are taken from public reporting and third-party estimates. Third-party estimates vary by source, so they are better read for direction and structure than for absolute levels.
NVIDIA’s fiscal 2027 second quarter, reported in August 2026, put Data Center revenue at $89.0B. In the same month Lumentum passed $1B in quarterly revenue for the first time, and GE Vernova’s gas equipment backlog and slot reservations reached 116GW. Compute, optics and power are entirely different markets, but the incremental demand behind all three starts in the same place.
The AI infrastructure buildout.
The problem is that the same demand does not create the same economics.
As AI capex moves down the stack, supply response time, supplier concentration, switching cost and contract structure all change. What matters for investors is not which bottleneck is most severe.
It is who can convert scarcity into pricing power, and whose pricing power amplifies into earnings. This note redraws the AI infrastructure investment map on that basis.
1. The Six Layers: Follow the Demand Signal Down the Stack
Response Time Matters More Than Component Labels
Splitting AI infrastructure into component categories such as compute, memory, networking and power is easy. For investment purposes that classification is not enough.
What matters more is how quickly each layer can turn incremental demand into capacity, shipments or monetization.
The upper layers are software and capital allocation problems. Further down, physical capacity is required: wafers, packaging slots, electrical equipment, generation and grid connections. The further the demand signal travels, the larger the capital commitment, the longer the lead time, and the harder it is to reverse a wrong decision.
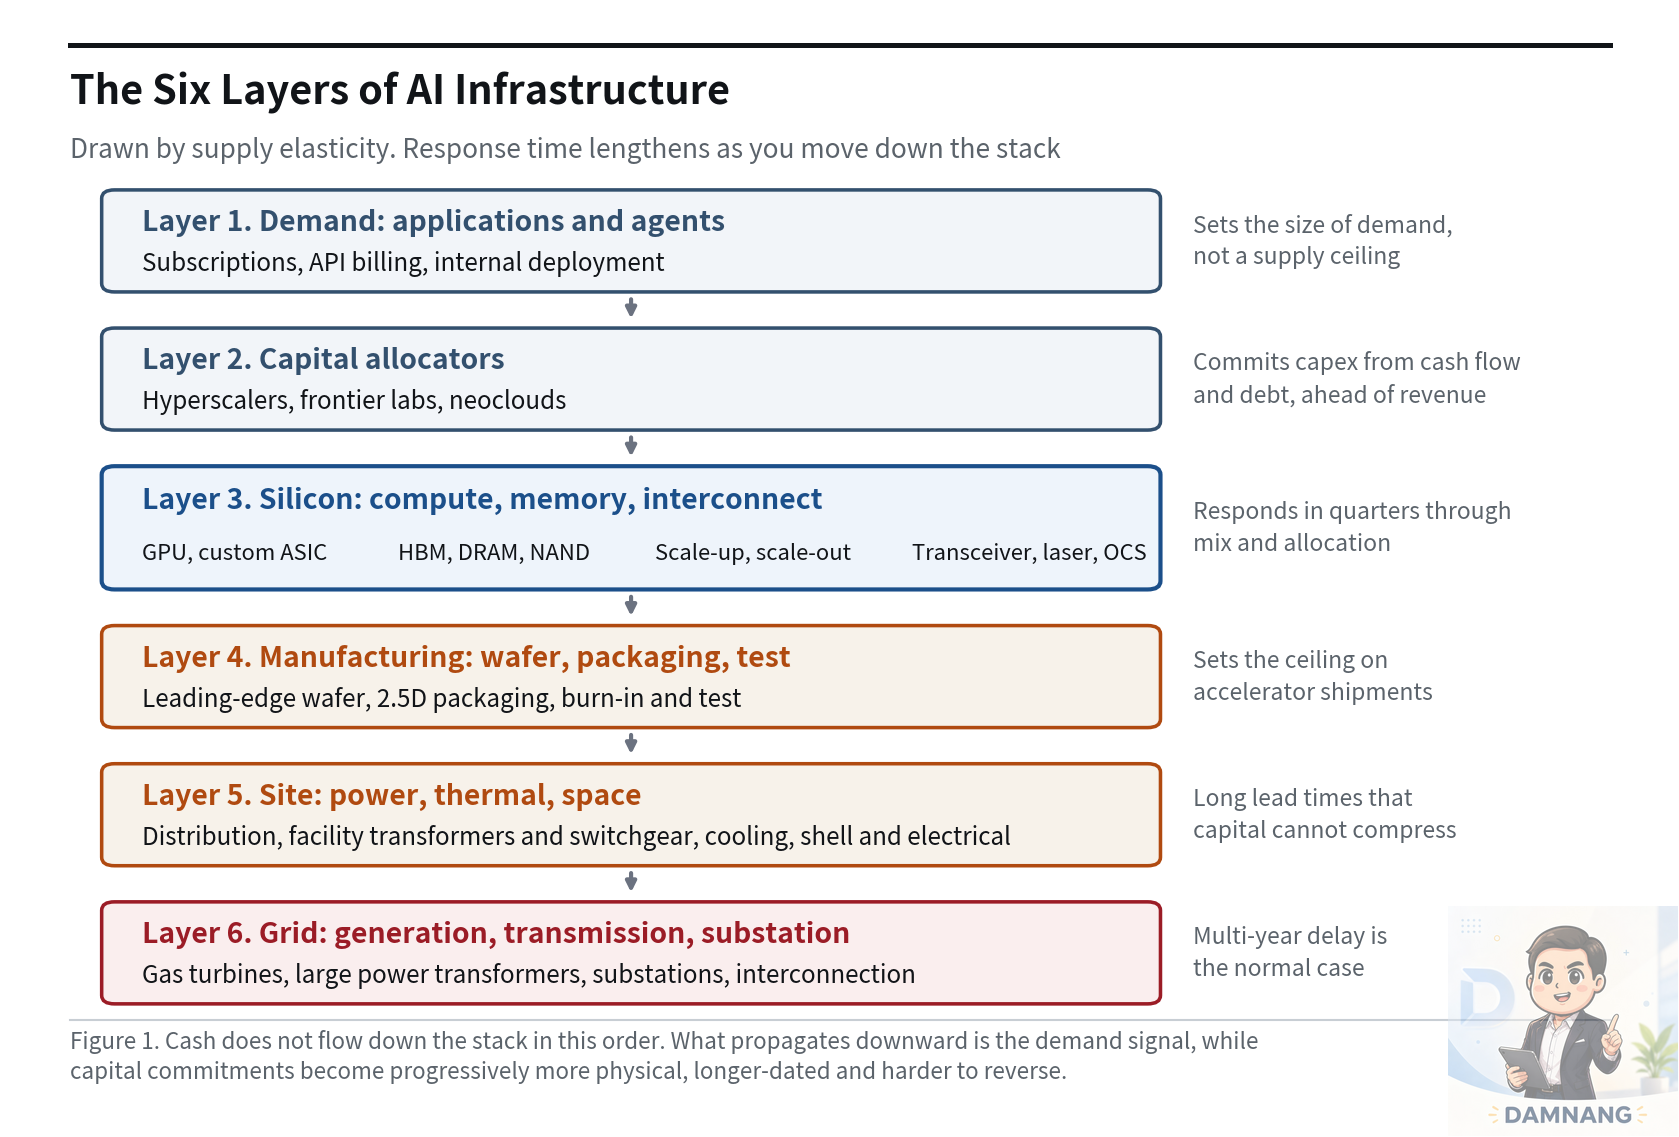
Layer 1: Demand.
Applications and agents consume tokens and create final demand. As of August 2026, press reports put OpenAI’s annualized revenue run rate near $40B and Anthropic above $65B. The two companies do not define revenue identically. What governs this layer is not a supply ceiling but monetization and willingness to pay.
Layer 2: Capital Allocators.
Hyperscalers, frontier labs and neoclouds decide the actual capital commitment. Amazon has guided to roughly $220B, Alphabet to $195B to $205B and Meta to $130B to $145B of 2026 capex. Including Microsoft, the four largest hyperscalers are on track to exceed $700B in 2026. Definitions of capex differ by company, but the direction is unambiguous. The absolute scale of capital entering AI infrastructure is still rising quickly.
Layer 3: Silicon.
Accelerators, memory and interconnect sit here. Product mix and wafer allocation can be adjusted at the margin, but structurally expanding leading-edge wafer and memory capacity takes several quarters to several years. Short-run elasticity exists, but it is not unlimited.
Layer 4: Manufacturing.
Leading-edge wafer, advanced packaging and test set the real ceiling on accelerator shipments. Even with logic and HBM ready, no finished part ships without a 2.5D packaging slot.
Layer 5: Site Infrastructure.
Power distribution, cooling, facility transformers and switchgear, and the building itself. As rack density moves into the hundreds of kilowatts, simply adding GPUs to an existing data center is reaching its limit. Electrical architecture and liquid cooling have to change together.
Layer 6: Grid.
Generation, transmission, substation and interconnection. Response time changes entirely. Large power transformer lead times have stretched into multiple years, and interconnection and energization in major data center markets take years.
Semiconductor constraints are measured in quarters and years. Grid constraints are measured in years. The reason the lower layers stay constrained longer is ultimately the difference in response time.
2. Bottlenecks Do Not Disappear. They Stack.
AI infrastructure is usually explained as a sequence of shortages. GPUs were short, then HBM and CoWoS, and now power. The direction is right, but real supply chains do not hand off that cleanly.
The earlier bottleneck remains in place while a slower constraint is added underneath.
The shorthand is that supply moved from accelerators to HBM and packaging and then to power. What actually happened is that the constraints piled up. Accelerators and the grid tightened first in 2023, HBM and advanced packaging in 2024, power and cooling in 2025, light sources in 2026.
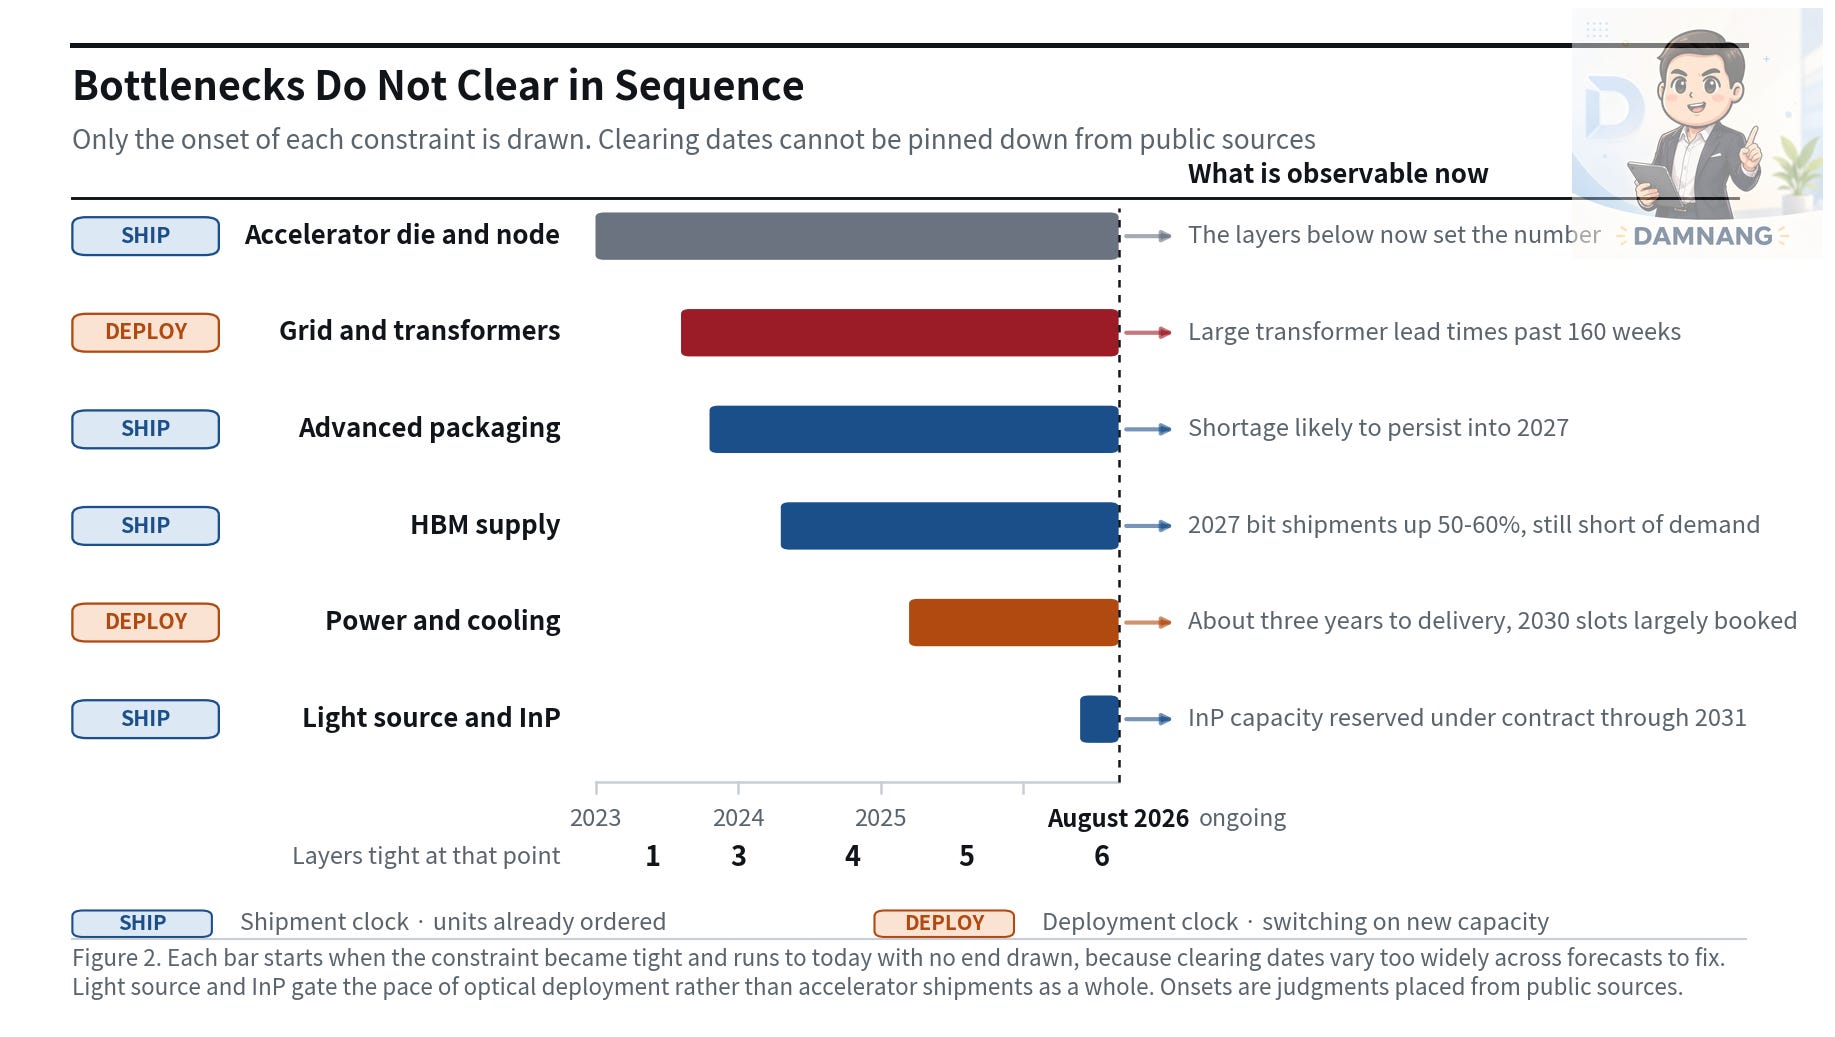
Power and grid decide when new capacity can be turned on. Memory and packaging decide how fast accelerators already ordered can be shipped. Both constraints exist at the same time. They simply bind different things.
As of August 2026 all six layers are tight. On the shipment clock HBM supply is tightest: 2027 bit shipments are projected to grow 50 to 60% and still fall short of demand growth. Advanced packaging is also likely to stay short into 2027. On the deployment clock grid interconnection and transformers are tightest, new heavy-duty gas turbine orders run about three years to delivery, and 2030 production slots are largely booked.
Accelerators were not solved after early 2024. What changed is that accelerators no longer set their own number. How many HBM stacks and packaging slots come out determines it, and rack-level selling pulls power and cooling into the same equation. Accelerator supply is now set by the bottlenecks below it rather than creating one.
Light sources and InP substrate turned tight in mid-2026. Lead times at the major light source suppliers run past 2027, and substrate capacity is now being reserved under contracts running to 2031. What this layer gates is the pace of optical deployment rather than accelerator shipments as a whole. Where copper still reaches, the constraint does not bind.
The grid did not appear in 2026 either. Large transformer lead times were already around 140 weeks in 2023 and passed 160 weeks in 2026. The onset of each of the six is documented. The clearing dates are not: forecasts diverge too widely to fix one.
Why Power Stays Tight Longer
The reason the power constraint is likely to persist is simpler than any demand forecast. Supply response is slow. GE Vernova’s 2Q26 gas equipment backlog and slot reservations stood at 116GW against annual output targets of roughly 20GW in 2026, 24GW in 2028 and 30GW in 2030. The company has said new heavy-duty turbine orders run about three years to delivery, and 2030 production slots are largely booked.
That number is not a statement about long-run TAM. It says factory throughput is the near-term supply ceiling. Strong demand does not turn 20GW of annual output into 50GW the following year.
Workarounds Move the Bottleneck
The grid constraint is not absolute. Hyperscalers and developers are expanding behind-the-meter generation and on-site power rather than waiting for a grid connection. But as that path grows, the bottleneck does not disappear. It relocates. Interconnection scarcity falls, and scarcity in gas turbines, generators and fuel infrastructure rises.
So what an investor should look for is not the largest market. It is the point where incremental demand meets the least elastic supply.
3. Scarcity Is Not an Investment Thesis
A Bottleneck Must First Become Pricing Power
A severe bottleneck does not automatically enlarge the profit pool of the industry that sits in it. Shortage is a physical condition; pricing power is an outcome of market structure.
Whether scarcity converts into supplier economics turns on four things.
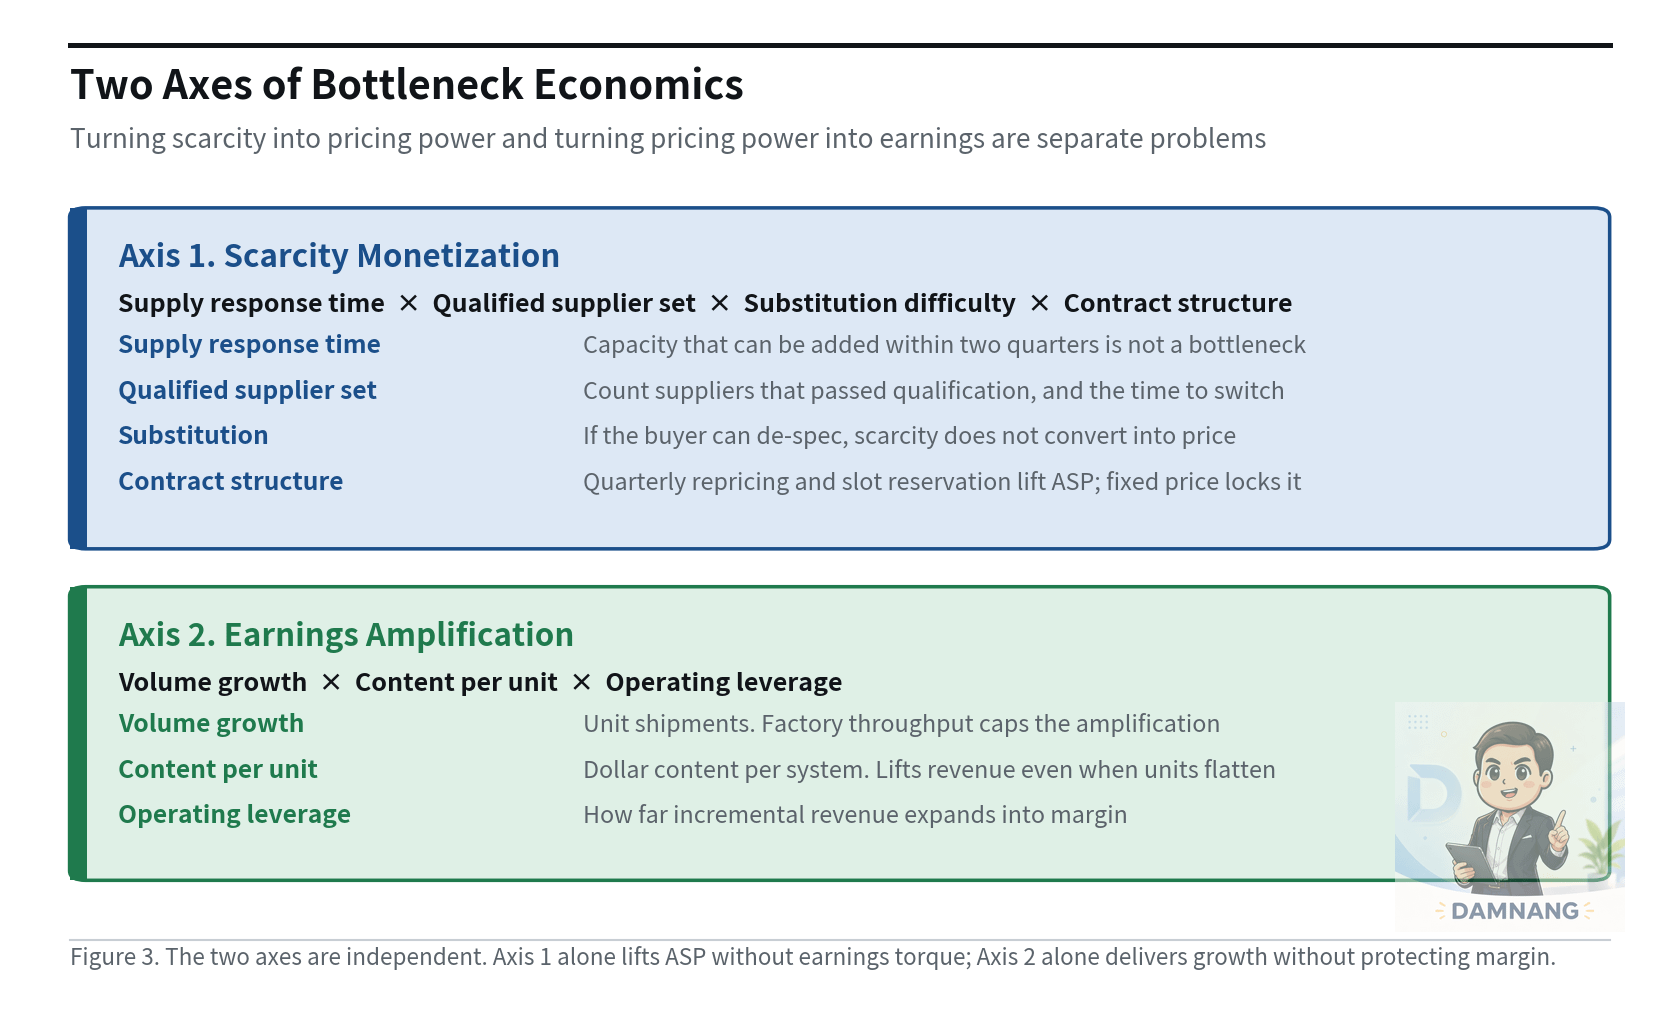
1. Supply Response Time.
How quickly can capacity expand once demand rises? HBM is limited by wafer capacity and qualification, gas turbines by manufacturing throughput, transformers by electrical steel and winding capacity. The longer the response time, the longer scarcity pricing can persist. Memory, light sources, gas turbines and transformers clear this test. Module assembly and construction do not: capital and labor expand them within a few quarters.
2. Qualified Supplier Set.
The number of suppliers a customer can actually use matters more than the number that exist. If second-source qualification is easy, buyer bargaining power can be strong even with few suppliers. If requalification takes years, the customer is effectively locked in even with several suppliers on paper. Optics is the clearest split here. Transceiver assembly has dozens of competitors while the laser and substrate above it have very few, which means the verdict on this test differs by layer inside the same industry. Data center electrical construction fails it outright.
3. Substitution and Workarounds.
Can the customer use less of the component or change the architecture? Memory is the clearest case. A shortage of HBM does not force buyers to accept any price. They can lower memory capacity per accelerator or reallocate system budget to another resource. Pricing power and buyer workarounds can coexist. Among the layers that score well on the first two, memory is the clearest example of losing points here. Grid has a workaround too in behind-the-meter generation, but that path does not remove scarcity. It moves it to the turbine.
4. Contract Structure.
This determines how fast scarcity reaches ASP. Long-term fixed-price contracts delay repricing even in a shortage. Memory runs on annual contracts, but suppliers hold the stronger hand in allocation and in negotiating the following year’s price. Turbine slots go to reservation competition. In those structures scarcity converts into price. Colocation fails this test because contract terms are long, and electrical construction never engages it at all because pricing is set by competitive bidding.
The four items are a scoring frame, not a pass-fail test. Taken together, memory, light sources and the substrate above them, large-frame gas turbines, and transformers and switchgear score highest. Memory loses points on the third item, and optics loses points there too because the coupling architecture can change. Advanced packaging is easing on the first item, so its score is drifting down. Data center electrical construction is weak on the second and fourth, and colocation on the fourth. That is why the layer with the most severe bottleneck has the weakest supplier economics.
Shortage and pricing power are not the same thing.
Supply response time, qualified supplier set, substitution path and contract structure are what connect them.
What I track: Qualified supplier count · Supplier switching and qualification time · Contract duration · Repricing frequency. When those four move toward broader and longer, pricing power weakens even while the bottleneck holds.
4. Pricing Power Still Has to Become Earnings
Even after pricing power is confirmed, one question remains. How far does that price amplify into earnings growth?
Volume Growth × Content per Unit × Operating Leverage
Pricing power is the ability to convert scarcity into ASP. Earnings amplification asks how far that ASP and the demand environment expand into company results through volume, content and margin.
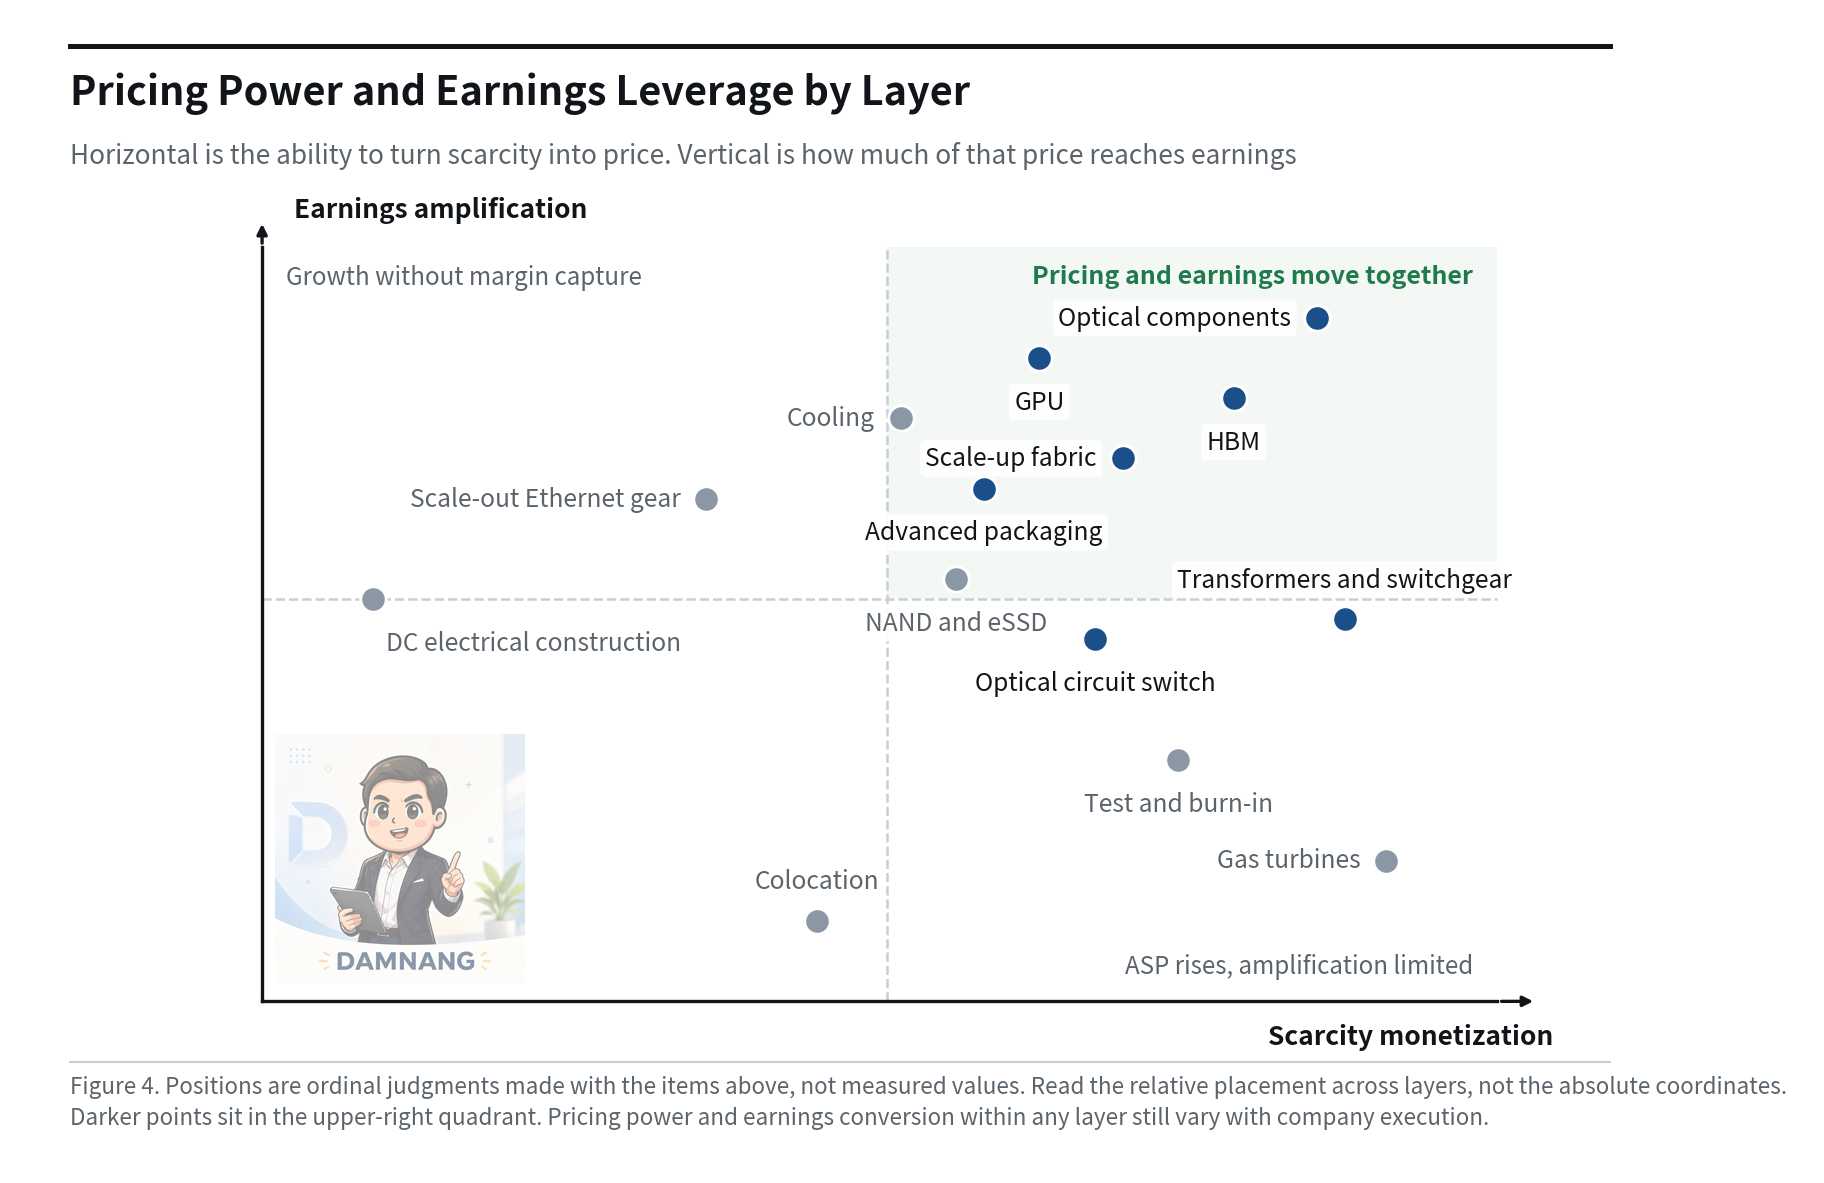
Gas Turbines: Strong Pricing, Slower Volume
Gas turbines score very high on the first axis. Contracted demand exceeds several years of annual manufacturing capacity, large-frame suppliers are few, and customers cannot easily switch technology. But earnings amplification is tied to factory throughput. Price and mix can improve quickly; unit shipments cannot double in the near term.
Electrical Construction: Severe Bottleneck, Little Left Over
Data center electrical construction is the opposite. Labor and project capacity are short and lead times are long. But the contractor base is fragmented and large buyers can use competitive bidding. The place where scarcity is most severe is not the place where the supplier profit pool is largest.
Memory: Strong on Both Axes, with a Content Offset
HBM scores well on both axes. Supply expansion is slow, qualification is difficult, and suppliers hold the stronger hand in annual contract negotiation. At the same time, bandwidth requirements rise with each accelerator generation.
Content de-spec has to be tracked alongside price. Even with ASP rising, a lower HBM capacity per accelerator partially offsets dollar content growth. In memory, HBM price and GB per accelerator have to be read together.
Test and Burn-in: Volume Rises, Amplification Does Not
Test scores reasonably well on the first axis. Taller stacks and more complex packages add test steps and test time, so equipment demand follows. It is the second axis that binds. Tools stay in place across several generations and replacement cycles are long, so revenue arrives in steps. Volume is secured, but sustained earnings amplification is harder to reach.
Optical Components: Scarcity with Architecture Risk
Optics is an area where unit growth and content growth can appear at the same time. Laser and some upstream optical component capacity is limited, and moving from 800G to 1.6T and then 3.2T raises the dollar content of certain components.
NVIDIA’s March 2026 investment of $2B each in Lumentum and Coherent, together with multi-year purchase commitments and capacity access, shows this scarcity is a procurement issue rather than a market narrative. At the same time optics carries more architecture risk than memory. If CPO scales quickly, bandwidth can grow while dollar content in pluggable transceivers and some components falls.
Bandwidth growth is not the same as optical revenue growth.
5. Silicon: Compute and Memory
Within silicon, compute and memory run on different drivers, so the numbers that would disprove each are different.
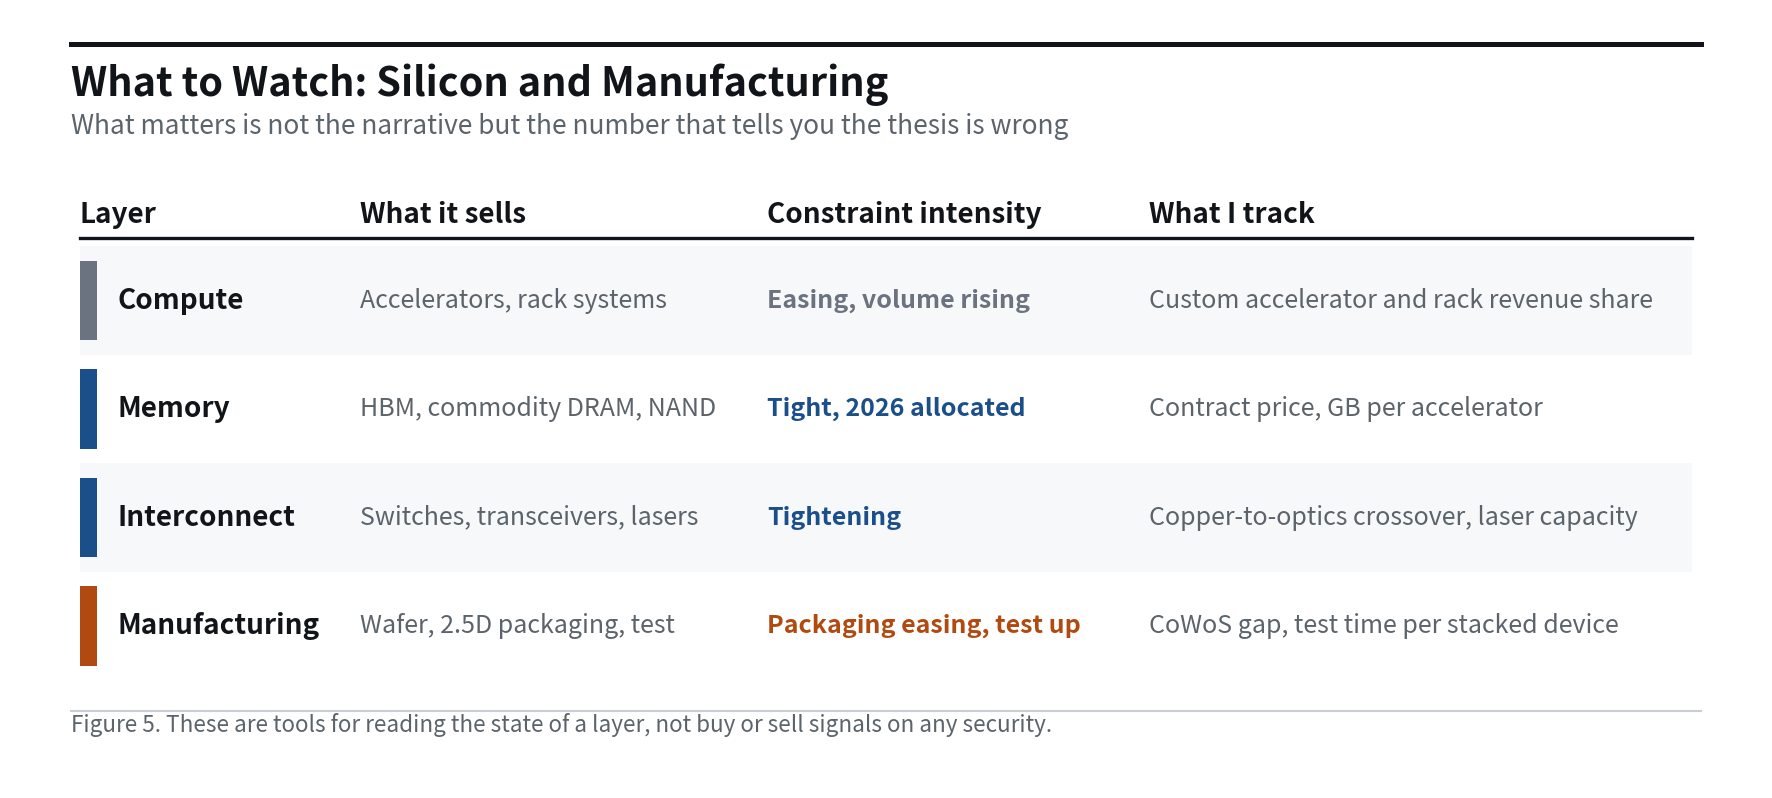
Compute
The accelerator is still the single largest line in the AI system BOM. But as hyperscaler custom ASIC deployment grows, merchant GPUs alone no longer describe total compute economics.
Counterpoint estimates that roughly 27.8% of 2026 AI server shipments are built on custom ASICs. A separate third-party tracker, Presenc AI, estimates hyperscaler in-house accelerator deployment at roughly 1.9M units. These are external tracker estimates rather than audited shipment data.
Unit share and revenue share also move differently. Internal ASICs carry different accounting economics from merchant accelerators, so a rising custom silicon unit share does not pull merchant system revenue share down at the same pace.
What I track: Custom accelerator shipment share · Rack-level system revenue share.
Memory
HBM remains tight. SK hynix disclosed a 56.4% share of HBM revenue in the first quarter of 2026 in its US registration statement. More important is that HBM changes how wafers are allocated across the entire memory market.
HBM consumes more wafer capacity than conventional DRAM to produce the same bit. As HBM mix rises, capacity allocated to commodity DRAM falls, and DRAM pricing unrelated to AI can be affected. The current memory cycle includes this cross-market effect, not just HBM demand itself.
What I track: Next-year HBM contract pricing and the direction of negotiations · HBM capacity per accelerator. Supplier earnings leverage is strongest when price and GB per accelerator rise together.
6. Data Movement Is Taking More of the System
As compute performance rises, the cost of moving data rises with it. The larger the cluster, the more peers each accelerator has to talk to, and the higher the lane speed, the shorter the copper reach. Networking is no longer a peripheral budget attached to compute. It is becoming a variable that determines system architecture.
OIF released the CEI-448G framework document in November 2025 and launched the CEI-448G-VSR and LR projects in the first quarter of 2026. The open question is not whether 448G electrical is feasible. It is how far electrical reach can hold in the generation after that.
Scale-Up and Scale-Out Have Different Economics
Scale-up and scale-out should not be divided by the rack boundary. Scale-up is the fabric inside a tightly coupled accelerator domain, and that domain can extend across multiple racks. Scale-out connects multiple scale-up domains or clusters.
The economics differ as well. Scale-out is Ethernet-centric with a broad supplier set. Scale-up ties protocol and architecture more deeply to a compute platform. Switching cost and supplier concentration are generally higher on the scale-up side.
The Optical Bottleneck Often Sits Above the Module
Part of today’s optical scarcity shows up in upstream components rather than the complete transceiver. Lumentum reported pump laser shipments up more than 80% year on year and has expanded EML capacity repeatedly. In the 1.6T generation, 200G EML pricing is higher than the prior generation.
Moving up from the transceiver, the chain runs module assembly, laser chip, epitaxy, InP substrate. Effective suppliers thin out and substitution gets harder with each step up. Module assembly has dozens of competitors and seven of the top ten are Chinese. Laser chips come from fewer than five firms at volume, and volume supply of the 200G per lane EMLs that 1.6T needs is narrower still, concentrated in a few leading suppliers. Above that, three firms hold 80 to 90 percent of InP substrate.
The supply numbers get worse the further up you go.
TrendForce reports that lead times at the major EML suppliers have stretched beyond 2027. Consulting estimates cited in public reporting put 800G transceiver production 40 to 60 percent below demand through 2027, and 1.6T 30 to 40 percent short through 2029. At the substrate level, buyers have begun paying to reserve capacity years in advance. Epitaxy is either done in house by the laser makers or sent to a small set of specialist foundries, and MOCVD tools are export controlled, so expansion is gated by tool lead times.
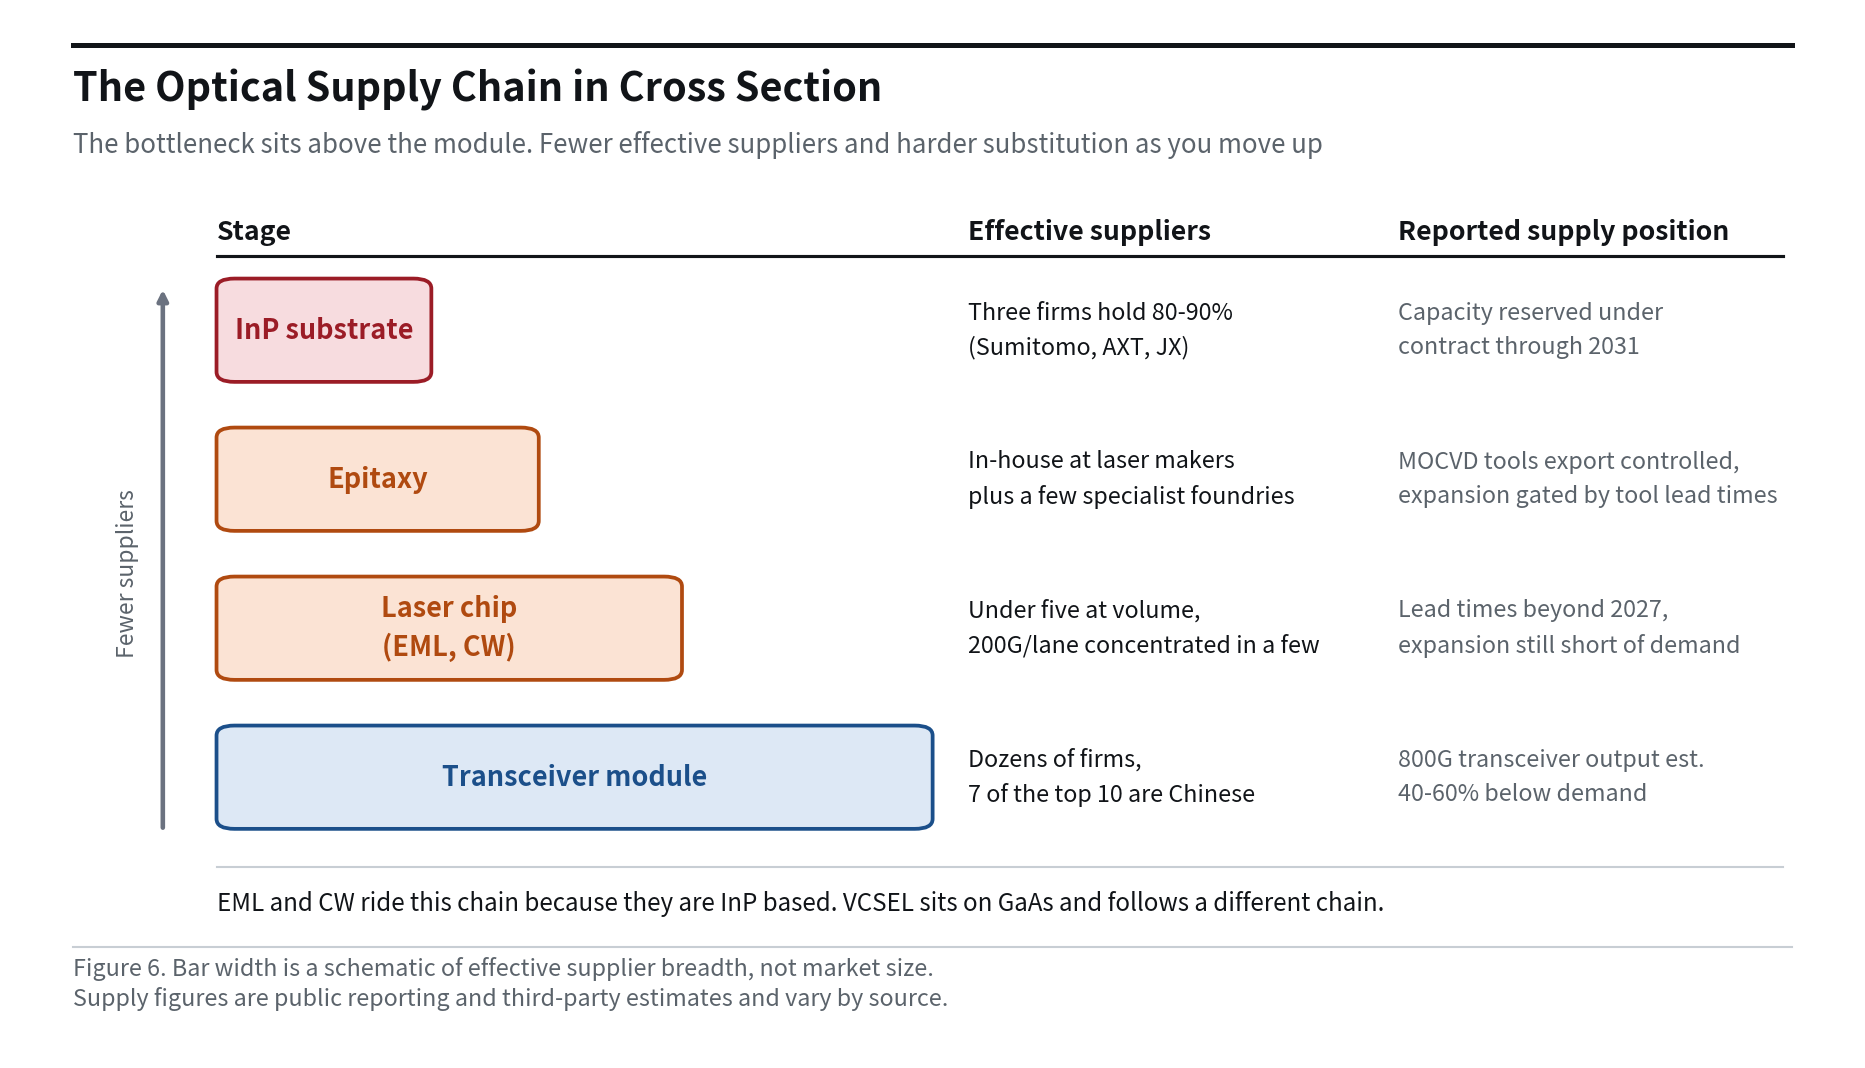
This is where the second test from section 3 actually binds in optics.
The set of qualified suppliers narrows at the substrate and the light source, not at the module. Contract structure is changing at this level too. AXT disclosed in July 2026 that it signed a supply and capacity reservation agreement with Lumentum for InP substrate running through the end of 2031, with Lumentum paying a $43.5 million deposit up front and a second $43.5 million to be settled in 2028. Buying several years of capacity in advance is what happens when the part cannot be sourced on demand.
The chain above also splits by light source. EML and CW lasers sit on InP substrate and ride this chain directly. VCSEL sits on GaAs and follows a different one. Moving to silicon photonics does not remove the need for a light source, so InP demand does not disappear.
In a chain that narrows as it goes up, unit growth and content growth can appear together. But company dispersion is wide. Within the same optical upcycle, growth and margin trajectories differ sharply by supplier.
Being long optics does not mean being long every optics company.
What I track: Interconnect and optics BOM / total rack BOM · Optical transceiver count per rack · Scale-up domain size · Laser capacity additions converting into actual shipments.
7. Manufacturing Is Splitting in Two Directions
Advanced packaging is still tight, but the intensity of the shortage is easing. Industry estimates cited by TrendForce suggest TSMC’s CoWoS monthly capacity could expand to roughly 120K to 140K wafers in 2026, and that industry capacity including OSATs could approach 200K per month. The same source expects the CoWoS supply-demand gap to narrow from roughly 20% to about 10% by the end of 2026.
These are industry estimates rather than official TSMC monthly capacity guidance, and estimates published at the same time point the other way: 2027 CoWoS demand more than doubling in wafer terms and leaving a 10 to 20% shortfall even at industry capacity near 200,000 wafers a month. A TSMC executive said in August 2026 that capacity is now close to demand and that the bottleneck is moving upstream to materials such as ABF substrate. Either way the direction is the same. As a bottleneck eases, volume growth and mix matter more than pricing upside, and what remains binding moves further up the chain.
Test moves the other way. As HBM stacks get taller, package complexity increases and optical components move into the system, the number of test steps and total test time can rise. Test economics become more sensitive to process complexity and test intensity than to wafer volume.
What I track: CoWoS supply-demand gap · Test time per package or stacked device.
8. Power Is Now the Deployment Clock
The layer that most tightly constrains the turn-on timing of new AI capacity is power and grid. GE Vernova said new gas turbine order pricing in the first half of 2026 rose further from prior levels. In transformers and switchgear, data center developers and utilities compete for the same manufacturing capacity.
Wood Mackenzie estimates cited in public reporting see the US data center electrical equipment market expanding from roughly $20B in 2026 to $65B by 2030. Over the same period US data center capacity is projected to grow from roughly 24GW to about 100GW.
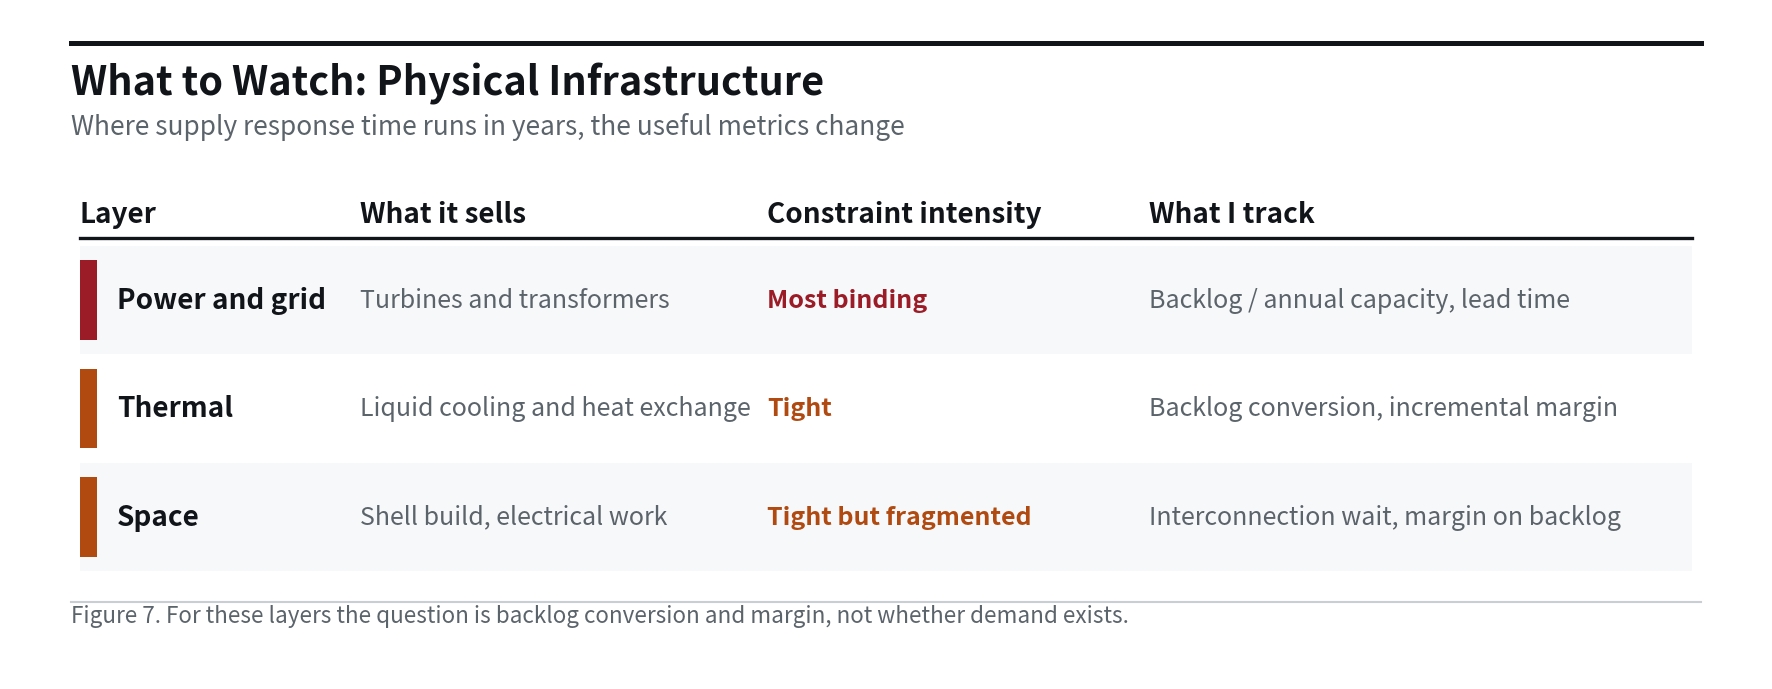
Revenue growth alone is not enough in this market. What tells you whether scarcity is holding is backlog divided by annual manufacturing capacity and equipment lead time. When both start falling consistently, pricing power starts weakening with them.
9. Thermal Is an Execution Story
Cooling and power management are past the stage of having to prove demand. Vertiv reported second quarter 2026 revenue of $3.274B, up 24%, with adjusted operating margin reaching 22.6%.
The question in this layer is not whether the orders exist. It is how fast backlog converts into revenue, and whether margin holds through that conversion.
Space and construction are different again. Shell construction and electrical work face severe shortages too, but the contractor base is fragmented. Colocation reprices slowly because of long-term contracts. Even inside the same physical infrastructure layer, how severe the bottleneck is and whether it leaves any profit have to be assessed separately.
What I track: Backlog conversion · Incremental margin · Lead-time normalization.
10. Demand Is the Reset Condition
Applications and frontier models should not be judged with the scarcity framework. This layer has no physically fixed supply ceiling like an HBM wafer or a transformer factory. What matters is monetization.
Hyperscaler capex is on track to exceed $700B in 2026. Sustaining infrastructure spending at that level requires AI revenue, cloud demand, advertising monetization and enterprise productivity to eventually justify the capital intensity. Frontier lab revenue is only one part of that. Hyperscalers carry a far larger cloud, advertising and software cash flow base.
So I do not simply compare frontier lab revenue with capex. The more useful question is whether AI monetization is expanding in the same direction as infrastructure spending.
Demand reset condition: if capex guidance from the major hyperscalers is cut for two consecutive quarters, the demand map has to be redrawn before the supply map.
11. Two Calls and One Principle
The two judgments below are the base case the current data supports. If the conditions change, the calls change with them.
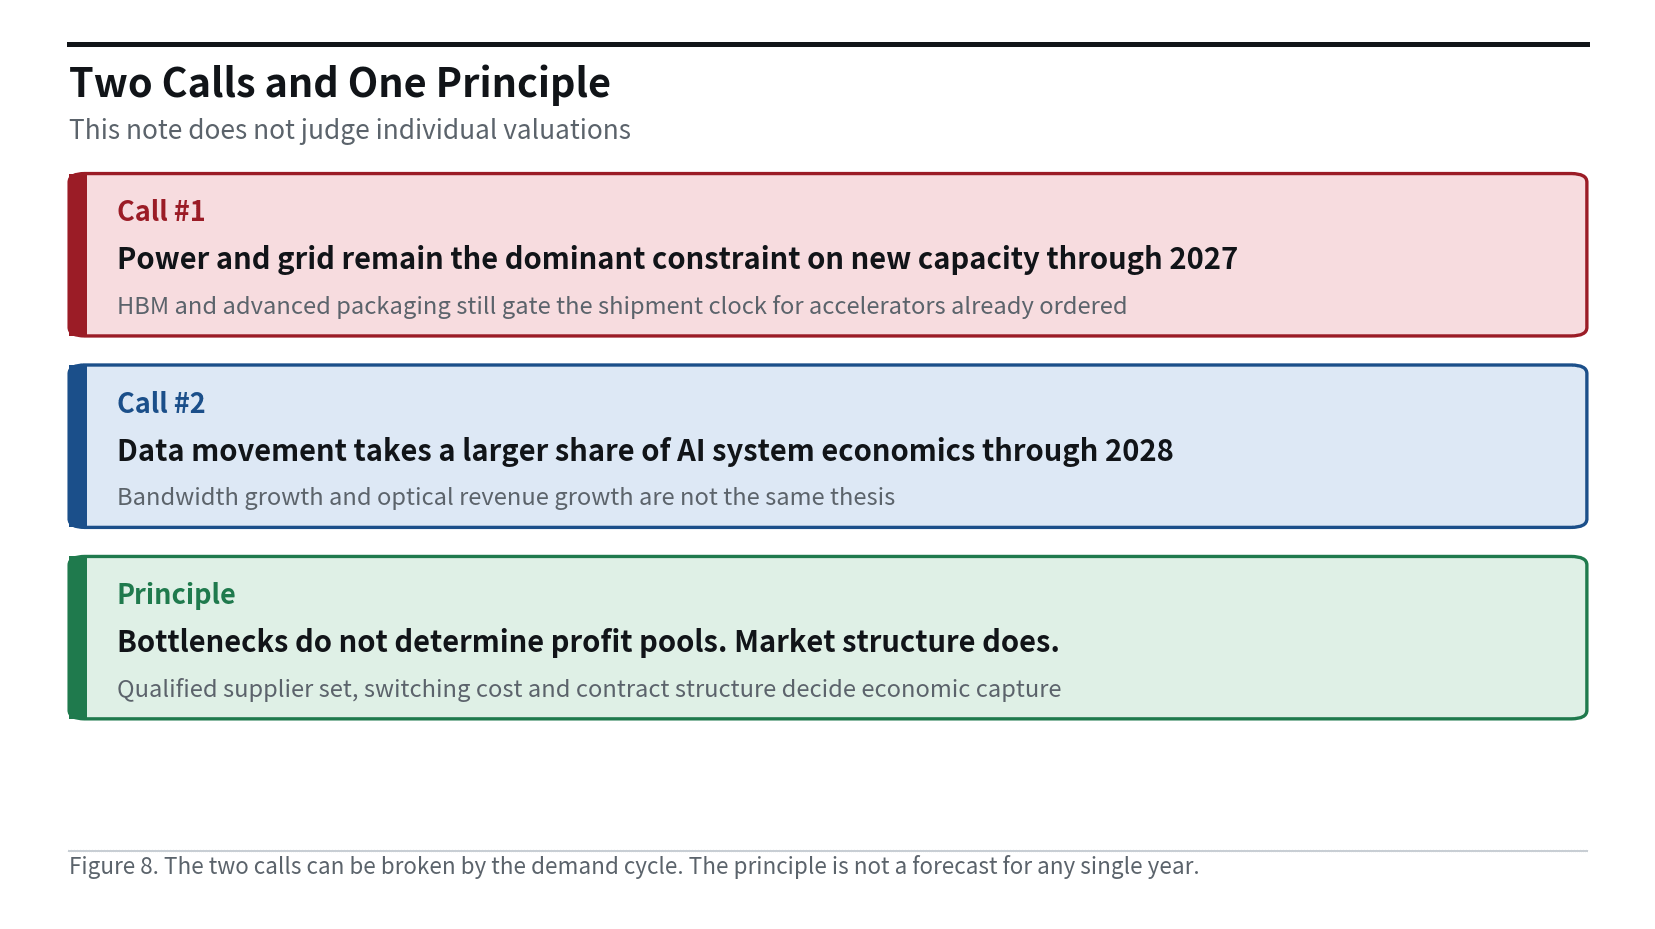
Call #1: Power and Grid Remain the Dominant Constraint on New Capacity Through 2027
My base case is that the dominant constraint on the turn-on timing of new AI capacity stays with power and grid at least through 2027. That does not mean the memory and advanced packaging shortages are over. They continue to gate the shipment clock. The difference is response time.
What I track: Gas equipment backlog / annual production capacity · Transformer lead time · Major data center market interconnection wait time.
What breaks the thesis: two or more of those three indicators improving materially for two consecutive quarters, or behind-the-meter generation becoming a standard deployment model so that grid connection no longer sets turn-on timing.
Call #2: Data Movement Takes a Larger Share of AI System Economics Through 2028
My second base case is that data movement takes a larger share of AI system economics through 2028. Cluster size is growing, and copper reach shortens as electrical lane speed rises. Larger scale-up domains and more high-speed connectivity follow.
This should not be read as a simple optics bull case.
If CPO is adopted quickly, the same bandwidth can be delivered with lower optical dollar content.
What I track: Interconnect and optics BOM / total system BOM · Transceiver count per rack · Scale-up domain size · Optical component capacity converting into shipments.
What breaks the thesis: scale-up domain size flattening for two consecutive generations, 448G-class electrical connectivity achieving longer reach than expected and delaying optical penetration, or CPO cost reduction moving so fast that bandwidth rises while optical dollars per system fall.
Principle: Bottlenecks Do Not Determine Profit Pools. Market Structure Does.
This is a structural principle rather than a forecast for any particular year. Where the bottleneck sits does not determine who keeps the profit. Qualified supplier set, switching time, substitution path, contract duration and repricing frequency do.
Memory and electrical construction make the point. Both can be in short supply. But memory has a limited supplier and qualification path, and suppliers hold the stronger hand in the following year’s price negotiation. Electrical construction has a broad supplier base and allows competitive bidding. The same shortage produces entirely different margin outcomes.
Bottom Line
AI infrastructure is neither one trade nor one bottleneck. Constraints exist across several layers at once, and the dominant constraint migrates toward the slower physical layers over time.
As of 2026, power and grid have begun to govern the deployment clock for new capacity. HBM and advanced packaging continue to gate the shipment clock. Data movement is likely to take a larger share of system economics.
But those three facts do not by themselves select an investment. Scarcity must become pricing power. Pricing power must become earnings.
What decides that conversion is not the shortage headline. It is market structure.
I will keep publishing analysis and articles at this level, and I am open to collaboration proposals around that work. Any form of collaboration is welcome. Please reach me at
research@damnang.com
Sources & Notes
Company results use official IR or SEC filings where available. Industry figures use public reporting and third-party estimates. Capacity and market-size numbers distinguish company guidance from third-party estimates.
NVIDIA, fiscal 2027 Q2 results (revenue $96.2B, Data Center $89.0B, gross margin 75%).
NVIDIA, fiscal 2027 Q1 CFO commentary (Data Center compute $60.4B, networking $14.8B).
GE Vernova, 2Q26 results 8-K (orders $24.2B, backlog $176B, gas equipment 116GW, capacity plan).
Reporting on GE Vernova gas turbine backlog and data center related orders.
Vertiv, 2Q26 results (revenue $3.274B, adjusted operating margin 22.6%, guidance raised).
Lumentum, fiscal 2026 Q4 results and conference call (revenue $1.006B, systems $357M, pump laser, OCS outlook).
Lumentum, August 2026 Deutsche Bank technology conference summary (copper reach and optical penetration, OCS demand).
OIF, Next Generation CEI-448G Framework Document released (November 2025).
OIF, CEI-448G-VSR and CEI-448G-LR projects launched at the Q1 2026 meeting.
NVIDIA, strategic partnership with Lumentum and $2B investment (March 2026).
NVIDIA and Coherent, strategic partnership and $2B investment (March 2026).
Comparison of Lumentum and Coherent fiscal 2026 Q4 results (Coherent revenue $2.05B, up 34% year on year).
SK hynix, US registration statement (56.4% share of HBM revenue in 1Q26, citing IDC).
TrendForce, CoWoS supply-demand gap outlook and capacity expansion plans.
Enterprise SSD contract pricing and segment revenue (1Q26, citing TrendForce).
DRAM and NAND contract price outlook (citing TrendForce).
Transformer lead times and PJM interconnection timelines.
US data center electrical equipment market size and capacity outlook (citing Wood Mackenzie).
Aggregated hyperscaler 2026 capital expenditure guidance.
Custom ASIC share of AI server shipments and growth (Counterpoint).
Hyperscaler in-house accelerator deployment estimate.
Frontier lab annualized revenue reporting (revenue definitions differ by company).
AXT, 8-K disclosing an InP substrate supply and capacity reservation agreement with Lumentum (July 29, 2026).
TrendForce, AI data center driven laser shortage and EML lead times beyond 2027.
InP epitaxy outsourcing and MOCVD export controls in the laser supply chain.
Sumitomo Electric raising the scale of its InP substrate expansion (JPY 18 billion).
InP substrate supplier concentration.
2027 CoWoS demand and capacity estimates, with a 10 to 20% shortfall.
TSMC executive on CoWoS capacity approaching demand and the bottleneck moving to ABF substrate (OCP APAC, August 2026).
TrendForce, 2027 HBM bit shipments up 50-60% and still short of demand growth.
GE Vernova lead times on new gas turbine orders and the state of 2030 production slots.